
between "Runs Of Length 1" versus "Runs Of Length > 1".
A run of length x is always observed after the fact. For example, playing Red/Black, we will observe a run of length x only when the run ends, i.e., one spin later.
R,B,B,B,R,... We have one run of length 1, one run of length 3 and one we don't know yet as we do not see its completion.
Here is my suggestion on how to track RUNS during the course of a session. Keep a count which will increase +1 when you observe a run of length > 1 and decrease -1 when you observe a run of length 1. That's it, as simple as that. We are not interested to note how long is a run, we just want to count how many runs last 1 spin versus runs which last more than 1 spin.
Let's look at the evolution of this count for a given day (Wiesbaden table 2 - February 14, 2008) :
-1, 0, 1, 2, 1, 0, -1, -2, -3, -2, -1, 0, -1, -2, -3, -4, -5, -4, -5, -4, -5, -6, -5, -6, -7, -6, -5, -6, -7, -6, -7, -6, -5, -6, -7, -6, -7, -6, -7, -6, -5, -6, -7, -8, -7, -8, -7, -6, -7, -8, -9, -10, -9, -10, -9, -8, -7, -6, -5, -6, -7, -8, -9, -10, -9, -10, -11, -10, -11, -10, -9, -10, -9, -10.
By simply looking at the evolution of the count, we can deduct there have been more runs of length 1 than runs of length > 1.
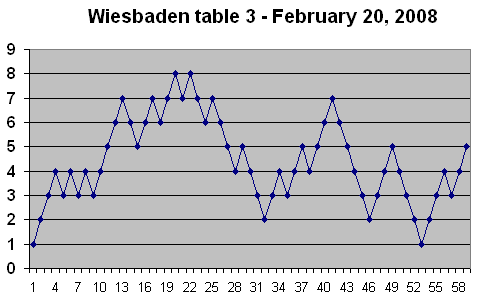
Let's look at it by converting the count into a graphic representation...
Graph representing Runs Of Length 1 versus Runs Of Length > 1
 |
| roulette system results |
I'll get back to the method later on. Meanwhile try to see by yourself by looking at the graph or the count above how you could come up with a tactic to exploit these "Runs Of Length 1" versus "Runs Of Length > 1".
You'll be agreeably surprised.
Here is a run i did on 10000 spins from Hamburg :
 |
| strategy results |
----------
comment:
Just want to point out that the first length is unknown as well because we do not know what came before it. So with the above string, all we can say for sure is the length of 3
------
Yes, you are right of course, we can eliminate both, the one at the beginning and the last one as we won't see the end of it.
All in all, runs of length = 1 or >1 should be equal over an extended period of play but again we can easily see there are limits on both sides.
When it goes up it is a run of length > 1, when it goes down it is a run of length = 1.
 |
| Wiesbaden casino roulette table results |
 |
| Roulette table 3 graph |
 |
| System profit |


If it is not regularity i wonder what it is


--------
THE SYSTEM
As you update the count of RUNS you'll notice that some values of this running count keep repeating more than others. Your objective will be to target those values which repeat the most. This can't be easier than this. Look at the following graph where the evolution of the count is shown (Wiesbaden, February 21, 2008 Table 2).
When a run of length > 1 is observed, the curve goes up /. When a run of length 1 is observed, the curve goes down \. I have used a red rectangle to stress some periods of play where the same count value kept repeating over and over.
Trying to understand this Arte. What do you mean by keeping a running count? Do you sit at a table and keep a note of how many times numbers switched from Red to black or black to red?
And are you saying that everytime you get a switch you can expect more lengths of 1eg RBRBRB?
I don't get it. Please explain more.
-------
| Quote: |
| And are you saying that everytime you get a switch you can expect more lengths of 1eg RBRBRB? |
| Quote: |
| As mentioned in my first comment, it's easy to track the many RUNS during the course of a session. We just need to keep a count which will increase +1 when we observe a run of length > 1 and decrease -1 when we observe a run of length 1. We are not interested to note how long is a run, we just want to count how many runs last 1 spin versus runs which last more than 1 spin. |
R
R
R
B < count = 1
R < count = 0
R
R
R
R
B < count = 1
B
B
B
R < count = 2
R
R
R
R
R
B < count = 3
R < count = 2
etc.
Here is table 2, february 22, 2008

Here is the frequency of the different count values at the end :
1 2
0 4
-1 5
-2 10
-3 15
-4 15
-5 14
-6 14
-7 13
-8 10
-9 14
-10 14
-11 5
-12 4
-13 3
Variations to the roulette system
Beginning a play it starts at 0.
After a serie plus 1, after a single coup - 1 .
Most of the time it begins to drift till - 7,8 or more, the same with + like plus 7, 8 or more.
Playing on all 3 even chances there must be a way to exploit this.
The question is :
When is the best time to begin :
When I begin to play at -1 single coups and it becomes zigzaging like: -1, 0, +1,0,-1,0,-1,-2,-1,0, you will loose if you change at +1 to playing the series.
The important question for me is: Where is the best entrypoint to play series or singlecoups.
If you begin at -1 and you decide to play consequently single coups and after +1 you play again single coups and the trend goes to e.g. -3,-4 or higher in the minus (more single coups) you are a winner, but if the trend changes you are in the loosing road.
Sunday, April 3, 2016